Azure
Synapse SQL Pool Resource Monitoring
Getting
resource metadata:
To
confirm the TempDB usage on a request level you can
leverage the following query:
SELECT
sum(pdw.bytes_processed) as 'bytes_written'
,CAST(sum(pdw.bytes_processed)/1024.0/1024.0/1024.0 AS Decimal(10,1))
AS 'GB_written'
,sum(pdw.rows_processed) as 'rows_written'
,pdw.request_id
from Sys.dm_pdw_dms_workers pdw
WHERE end_time is not null
AND pdw.type = 'Writer'
AND destination_info like '_tempdb%' or destination_info
IS NULL
group by pdw.request_id
HAVING CAST(sum(pdw.bytes_processed)/1024.0/1024.0/1024.0 AS Decimal(10,1)) > 1
Special thanks to Nick Salch for assisting with the correct metric to track.
If you need to monitor the
overall memory usage, you can leverage the following:
SELECT
pc1.cntr_value as Curr_Mem_KB,
pc1.cntr_value/1024.0 as Curr_Mem_MB,
(pc1.cntr_value/1048576.0) as Curr_Mem_GB,
pc2.cntr_value as Max_Mem_KB,
pc2.cntr_value/1024.0 as Max_Mem_MB,
(pc2.cntr_value/1048576.0) as Max_Mem_GB,
pc1.cntr_value * 100.0/pc2.cntr_value AS Memory_Utilization_Percentage,
pc1.pdw_node_id
FROM
-- pc1: current
memory
sys.dm_pdw_nodes_os_performance_counters AS pc1
-- pc2: total
memory allowed for this SQL instance
JOIN sys.dm_pdw_nodes_os_performance_counters
AS pc2
ON pc1.object_name = pc2.object_name
AND pc1.pdw_node_id =
pc2.pdw_node_id
WHERE
pc1.counter_name = 'Total
Server Memory (KB)'
AND pc2.counter_name = 'Target Server Memory (KB)'
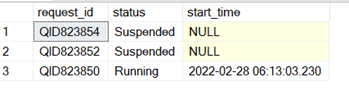
Whats holding up my query:
If a query is not running from the sys.dm_pdw_exec_requests,
to confirm if it is concurrency related or access to a resource.
First confirm that the session is in a suspended status
using sys.dm_pdw_exec_requests:

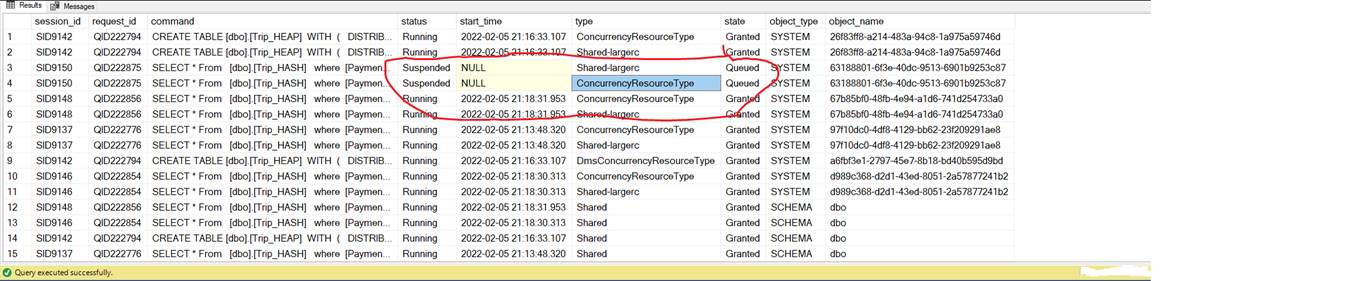
Next, using the following wait query to confirm what the
session is waiting on:
SELECT
waits.session_id,
waits.request_id,
requests.command,
requests.status,
requests.start_time,
waits.type,
waits.state,
waits.object_type,
waits.object_name
FROM sys.dm_pdw_waits
waits
JOIN sys.dm_pdw_exec_requests
requests
ON waits.request_id=requests.request_id
ORDER BY waits.object_name, waits.object_type, waits.state;
If you see the
state as queued and wait type as ConcurrencyResourceType
that is an indication that you do not have enough concurrency slots to execute
the query.
If there are a
few options.
If the session
is in a dynamic resource class or workload group, you can increase the DWU to
allow for more concurrency slots and concurrent queries.
Please review
the following for additional references: Memory and concurrency limits - Azure
Synapse Analytics | Microsoft Docs
Workload Group:
Alternatively, to provide more predictable memory and CPU usage.
We can leverage Workload Groups.
For example, lets
say we need to reduce the overall memory a particular session is using as it
seems to be consuming a lot of memory on the overall system.
We can first create a workload group as the below. For this
instance, we do not want any aggregate of sessions in this group to use more
than 50% of the overall memory CAP_PERCENTAGE_RESOURCE = 50.
In addition, for each request in this Workload Group, the request
is granted a minimum of 25% of the overall memory allocated to the Workload
group REQUEST_MIN_RESOURCE_GRANT_PERCENT = 25.
In
addition, we do not want a request to use more than 25% of the allocated memory
to that group REQUEST_MAX_RESOURCE_GRANT_PERCENT = 25.
Its important to note the Effective Values metrics from the following
link depending on the DWs allocated: CREATE WORKLOAD GROUP (Transact-SQL) -
SQL Server | Microsoft Docs
Because
this POC is being conducted on a DW100c, the least amount of resource per
request is 25% of the overall resource for that workload group. We will
illustrate more below.
Please
note that in most cases unless a very important job requires idle resources
that no other sessions can use, we will not set the MIN_PERCENTAGE_RESOURCE as
that pool of resources cannot be shared.
CREATE
WORKLOAD GROUP pocsmalltest
WITH
( MIN_PERCENTAGE_RESOURCE = 0
, CAP_PERCENTAGE_RESOURCE = 50
, REQUEST_MIN_RESOURCE_GRANT_PERCENT = 25
, REQUEST_MAX_RESOURCE_GRANT_PERCENT = 25
, IMPORTANCE = LOW
, QUERY_EXECUTION_TIMEOUT_SEC = 0 )
;
Next, we will proceed to classify a user to the workload group
with the below syntax.
create
workload CLASSIFIER pocsmalltestclassifer
WITH (WORKLOAD_GROUP='pocsmalltest',
MEMBERNAME= 'victor1' ,
IMPORTANCE=NORMAL)
Finally,
we will confirm how much memory is being utilized on the overall system. We
will be leveraging the following query: select * from sys.dm_pdw_nodes_resource_governor_resource_pools;
With
all sessions idle, we can see the current DWU allocation has a max of around
55GB with the used_memory_kb at 0 for
DW100c.

However,
once a session is executing, we can see that 2.9GB of memory has been allocated
to the single session to process its transaction.

But
what does this mean for concurrent queries?
Remember,
DW100c has a max of 4 concurrent queries. Please check the Effective Values
link for your respective DWU: CREATE WORKLOAD GROUP (Transact-SQL) -
SQL Server | Microsoft Docs
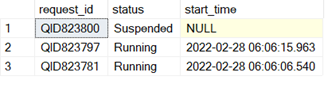
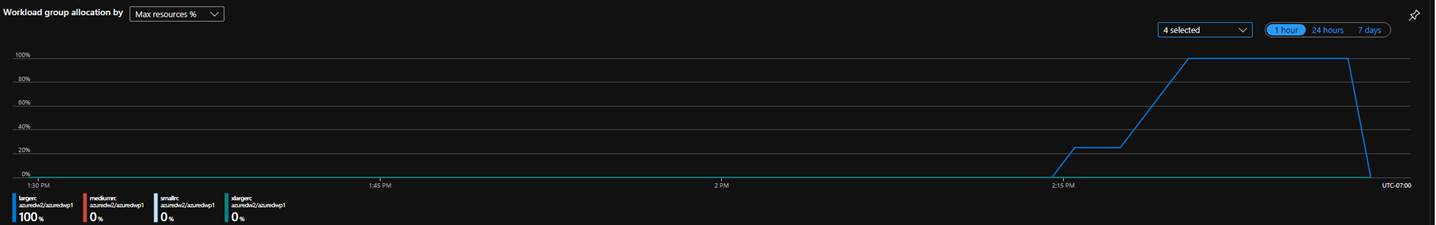
As
we can see below, we can only execute a max of two concurrent queries with the
current caps. 50% of overall resources, with a minimum of 25% per request.
Now,
to reinforce the concept of Effective Values for the corresponding DWU
allocation, lets alter the workload group and reduce the
REQUEST_MIN_RESOURCE_GRANT_PERCENT & REQUEST_MAX_RESOURCE_GRANT_PERCENT to
try to use even less resources.
ALTER
WORKLOAD GROUP pocsmalltest
WITH
(REQUEST_MIN_RESOURCE_GRANT_PERCENT = 3,
REQUEST_MAX_RESOURCE_GRANT_PERCENT = 10
)
As
you can see below, we still are allocated the same amount of memory for the
request, as the least effective value for DW100c is 25%.

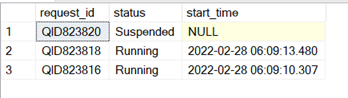
Let
not forget that concurrent query allowance will be the same as the above as 25%
is the minimal resource allocation:
Now, lets alter the
REQUEST_MAX_RESOURCE_GRANT_PERCENT to a higher value:
ALTER
WORKLOAD GROUP pocsmalltest
WITH
(REQUEST_MIN_RESOURCE_GRANT_PERCENT = 50,
REQUEST_MAX_RESOURCE_GRANT_PERCENT = 50
)
As we can see below, the request is now able to leverage 5.5GB of
memory. Nearly doubling the amount of memory allocated to the session.

However, we have essentially reduced the overall number of
concurrent transactions by increasing the min and max resource percentage,
please see below:
ALTER
WORKLOAD GROUP pocsmalltest
WITH (REQUEST_MIN_RESOURCE_GRANT_PERCENT
= 25,
REQUEST_MAX_RESOURCE_GRANT_PERCENT = 50
)
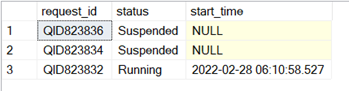
Even with bringing down the REQUEST_MIN_RESOURCE_GRANT_PERCENT,
the concurrency is bounded by the max value in the REQUEST_MAX_RESOURCE_GRANT_PERCENT
as we only can process one request, please see below:
But what
resource class or workload classifier is my user using:
Remember,
sys.dm_pdw_exec_requests will have the info as well.
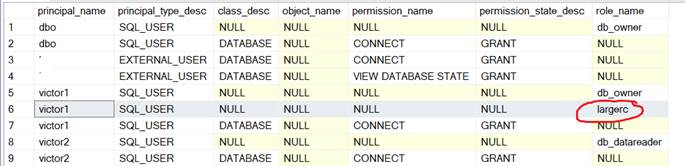
To
cross reference and check the resource class the user is in, you can use the
below query. The last column will outline the respective resource class.
WITH
perms_cte as
(select USER_NAME(p.grantee_principal_id) AS principal_name,
dp.principal_id,
dp.type_desc AS principal_type_desc,
p.class_desc,
OBJECT_NAME(p.major_id) AS object_name,
p.permission_name,
p.state_desc AS permission_state_desc
from sys.database_permissions p
inner JOIN sys.database_principals dp
on p.grantee_principal_id = dp.principal_id
)
SELECT p.principal_name,
p.principal_type_desc, p.class_desc,
p.[object_name], p.permission_name,
p.permission_state_desc, cast(NULL as sysname)
as role_name
FROM perms_cte
p
WHERE principal_type_desc
<> 'DATABASE_ROLE'
UNION
SELECT rm.member_principal_name,
rm.principal_type_desc, p.class_desc,
p.object_name, p.permission_name,
p.permission_state_desc,rm.role_name
FROM perms_cte
p
right outer JOIN (
select role_principal_id,
dp.type_desc as principal_type_desc, member_principal_id,user_name(member_principal_id) as member_principal_name,user_name(role_principal_id)
as role_name--,*
from sys.database_role_members
rm
INNER JOIN sys.database_principals dp
ON rm.member_principal_id
= dp.principal_id
) rm
ON rm.role_principal_id
= p.principal_id
order by principal_name
For
workload classifier verification, you can use the following:
SELECT
cl.classifier_id, cl.name, cl.group_name,
cl.importance, det.classifier_type,
det.classifier_value, cl.is_enabled,
us.altuid, us.gid, us.hasdbaccess, us.islogin, us.isntname, us.isntgroup, us.isntuser, us.issqluser, us.isaliased, us.issqlrole, us.isapprole
FROM sys.workload_management_workload_classifiers
cl
INNER JOIN sys.workload_management_workload_classifier_details
det
ON cl.classifier_id
= det.classifier_id
LEFT JOIN sys.sysusers us
ON det.classifier_type
= 'membername' and det.classifier_value
= us.name;
No SSMS no
problem:
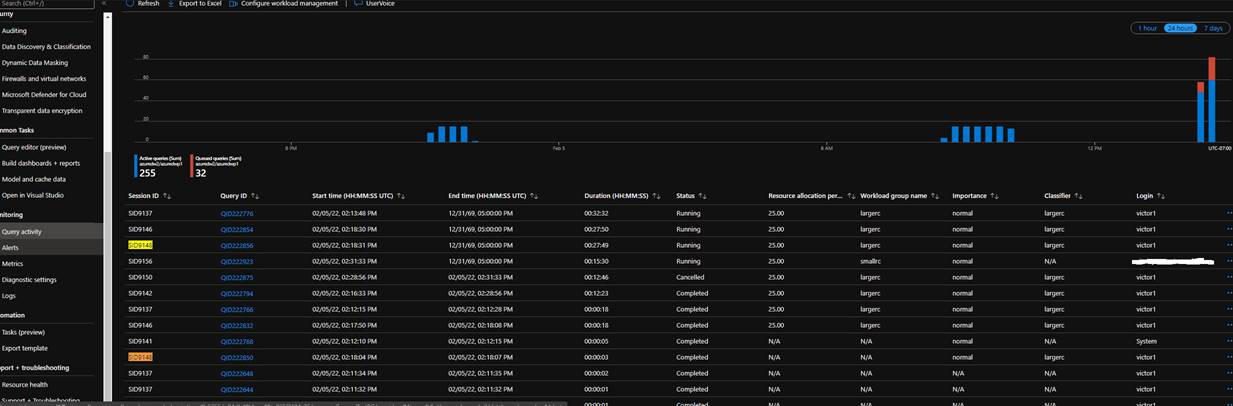
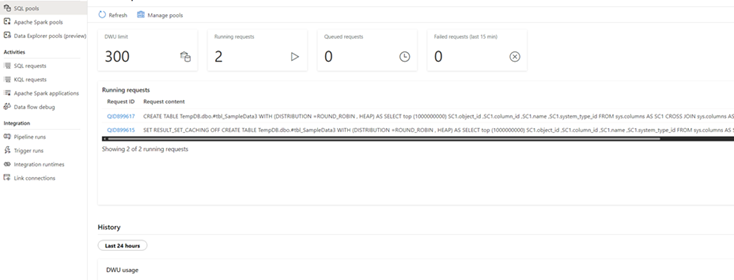
Alternatively,
in the Azure Portal, you can also monitor your resources.
This includes
query activity, which provides metadata of queued queries and active queries.
Please note that you can see the pending queries number but not the actual
queries, as you can the active queries.
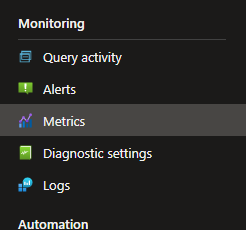
You can also
use the metrics section of the Azure portal to view various metrics metadata as
well.
Reference: Monitor your dedicated SQL pool workload
using DMVs - Azure Synapse Analytics | Microsoft Docs